Market Guide
Seoul Eco-Friendly Distribution Center Guide
Project Outline
Outline of the School Meal Service.
Check out the detailed operating system of the school meal service project of Seoul Eco-Friendly Distribution Center.
- Coverage : 1,326 schools & kindergarten in Seoul area (as of December 2022)
※ 270 Schools in 2010, 588 in 2011, 784 in 2012, 867 in 2013, 358 in 2014, 723 in 2015, 784 in 2016 , 832 in 2017, 876 in 2018, 937 in 2019, 1,002 in 2020, 1,036 in 2021, 1,326 in 2022 - Volume : 123 Tons Per Day (as of 2022)
Project Outline
- 1
Scientific verification: Inspection system to enhance food quality and safety
- Verification of certification for Eco-friendly agricultural products and inspection of the safety of Eco-friendly agricultural products and general agricultural products
- Improvement of test precision by securing super-precision safety test equipment (GC/MSD method)
- 2
Advancement of safety and credibility by building up an organic cooperative system with companies specializing in school meal service
- Suppliers : 25 for agricultural products (Eco-friendly, general, grains), 18 for livestock products, 23 for processed agricultural products
- Purveyors : 20 for agricultural products, 16 for livestock products, 8 for marine products
※ Recommendation by local governments, open recruitment, review by a judging committee, and selection
- 3
Developing efficiency of food supply by operating optimized logistics facilities and IT system
- Securing and operating online system for giving or accepting orders, control system (GPS/tachometer), and roll containers
Operating System
Operating system of the school Meal Service
Check out the detailed operating system of the school meal service project of Seoul Eco-Friendly Distribution Center.
Wonder how the food for school meal service for our children is distributed?
On March 4th the Seoul Eco-Friendly Distribution Center opened in the Gangseo Wholesale Market.
Let’s find out how the healthy school meal service for our children is prepared in the center. logistical migration At 9 pm, eco-friendly agricultural products from all parts of the country arrive at the center.
 sample inspection After checking temperatures, worrying if the product might have gone bad while being moved, the agricultural products are categorized by school. They are stacked in roll containers in the picking area on the 1st floor, and then, inspectors gets busy. In order to check the freshness of the stored products, they check if proper temperatures are kept with an infrared thermometer and verify the item, weight, Eco-friendly certificate, etc. with their PDA. It is essential to check food quality and freshness!!
 안전성검사 동시에 센터 2층 안전성검사실에서는 잔류농약검사가 진행됩니다. 친환경농산물 정밀검사를 위해 도입된 LC/MS/MS, LC, GC 장비를 활용하여 2012년 7월(2학기)부터 사전 안전성검사 체계를 구축 운영하고 있습니다. 2014년 12월부터는 급식재료의 안전성을 더욱 강화하기 위해 친환경농산물 사전 검사 건수를 확대하고, 일반 농산물도 퀘쳐스 검사(정밀검사)를 실시하고 있습니다.
센터로 입고되는 친환경농산물은 인증정보, 사전 안전성검사 여부 확인 및 정밀장비를 활용한 샘플링 검사를 수행하며 일반농산물은 검사 가능한 전 품목에 대하여 안전성검사를 실시하며 부적합으로 판정되면 전량 폐기처분하게 됩니다. 학교 배송 이렇게 철저한 검품검수와 안전성검사를 마친 농산물은 냉장 배송차량에 실어 학교로 공급됩니다. 이 때 각 냉장배송차량에는 GPS 장비가 설치되어 배송 중 차량온도, 위치 등을 실시간으로 확인하고 있습니다.
※ The Seoul Eco-Friendly Distribution Center thoroughly checks the food with the greatest care because it is the foundation of good food for children.
Operating system flow chart
Scroll side to side for more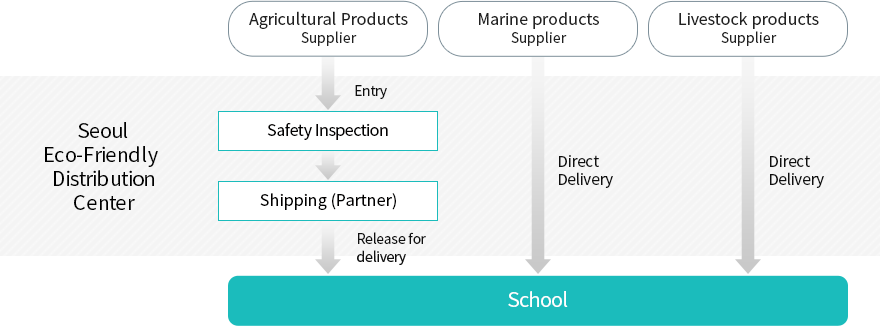
서울친환경유통센터
- 농산물산지공급업체에서 입고되면 검품-안전성검사 후 배송-협력업체에서 출고 되어 급식학교
- 수산물 공급업체에서 급식학교로 직배송
- 축산물 공급업체에서 급식학교로 직배송
Inspection System
Stocked Goods
-
1st Stock Inspection
- Stock inspection (Taste, Glycotoxin test, PDA test)
- Eco-Friendly Certification Check
- Safety Test
-
2nd School Inspection
- Vendor Inspection by School
- School quality inspection
- Center / Vendor Common Inspection
-
3nd goods inspection
(Specification by school)- Stock PDA Inspection
- Vendor Inspection
- Weight checking by item
Performance
2022년(1~12월) 사업성과입니다.
총 공급 물량 : 23,463톤(농산물 16,390톤, 축산물 5,214톤, 수산물 1,859톤), 안전성검사 : 26,186건
공급실적
(단위 : 톤, 백만원) 좌우로 스크롤해서 확인 가능합니다.| 구분 | 합계 | 농산물 | 축산물 | 수산물 | ||||
|---|---|---|---|---|---|---|---|---|
| 물량 | 금액 | 물량 | 금액 | 물량 | 금액 | 물량 | 금액 | |
| 2022년 | 23,463 | 218,800 | 16,390 | 103,266 | 5,214 | 77,789 | 1,859 | 37,745 |
| 2021년 | 18,099 | 165,681 | 12,681 | 78,287 | 3,974 | 57,902 | 1,444 | 29,492 |
| 2020년 | 8,696 | 75,172 | 6,249 | 36,817 | 1,869 | 27,141 | 578 | 11,214 |
| 2019년 | 22,202 | 179,957 | 15,864 | 90,235 | 4,867 | 63,559 | 1,470 | 26,163 |
| 2018년 | 20,304 | 162,019 | 14,417 | 80,440 | 4,490 | 58,197 | 1,397 | 23,382 |
| 2017년 | 19,063 | 151,453 | 13,640 | 74,669 | 4,087 | 55,198 | 1,336 | 21,586 |
| 2016년 | 18,182 | 142,706 | 13,109 | 68,029 | 3,821 | 56,051 | 1,252 | 18,626 |
| 2015년 | 16,150 | 118,289 | 11,821 | 60,202 | 3,278 | 43,750 | 1,050 | 14,336 |
| 2014년 | 7,421 | 52,008 | 5,532 | 28,174 | 1,759 | 22,014 | 130 | 1,820 |
(05699) 932, Yangjae-daero, Songpa-gu, Seoul, Republic of Korea Tel : +82 2-3435-1000
COPYRIGHT(C) SEOUL AGRO-FISHERIES & FOOD CORPORATION ALL RIGHTS RESERVED


